National Parks
Protected area management costs reveal budget shortfalls
Sep
The roles and responsibilities of Rangers (park managers) are diverse requiring knowledge and skills in fauna and flora ecology and conservation, and ecological processes such as pollination, water quality, nutrient regulation, soil formation and retention, air quality regulation, weed and feral animal control and fire management 1.
As well, they require knowledge and skills related to visitor management such as safety, education, communication, track development and maintenance, rehabilitation, cultural heritage, and cleaning facilities 1. Rangers are at the forefront of protecting nature for its own sake, for our sake, and for future generations.
No two days are the same for a Ranger and their work can be unpredictable often influenced by human induced or natural events such as floods, storms and fire 1. The 2007 Senate Inquiry into Australia’s national parks, conservation reserves and marine protected areas concluded that the resources allocated to Australian reserves are generally insufficient for effective management 2.
Fast forward 15 years, recent research by James Cook University echoes the findings of the Senate inquiry report 3. It highlights how each day a Ranger must prioritise actions and make trade-offs based on limited time, budgets and the current needs of the parks they manage. This shortfall in funding limits the ability of Rangers to carry out the activities required to achieve their objectives 3, 4.
As National Parks (NPs) have been established under different physical, social and economic environments it is only right that management activities are different across them. However, common across our NPs is the Cardinal Principal to provide for the permanent preservation and protection of the area’s natural (e.g. biodiversity and ecological processes) and cultural values.
To better understand the financial resources needed to manage Queensland’s NPs, in particular where Ranger time and resources are being dedicated, the research conducted by James Cook University investigated spending and costs appropriated by NP managers across 41 protected areas with diverse characteristics (e.g. size, visitation levels, remoteness, and presence of endangered species and ecosystems).
The protected areas where data were gathered are shown in the map. In total, the sample represented over one third of the 7.7 million ha of NPs in Queensland, and one fifth of the approximately 700 field management staff in Queensland Parks and Wildlife Service (QPWS).
Where available, management plans for the 41 protected areas were used to frame a consistent set of questions that were asked to park managers. Where management plans were not available, statements by managers of the park’s objectives were used. Managers were then asked to describe the specific outcomes they sought for these objectives, and to what standard they were actually being achieved using five performance scores of: Not at all (0), Poor (1), Fair (2), Good (3), and Very Good (4).
Once the parks objectives were determined, managers were then asked about the necessary activities and resources required (including dollars) to achieve them at these performance levels. Written records on actual spending for the parks over the previous three financial years were obtained and then averaged for a yearly figure.
Managers also provided estimated costs of achieving the performance levels of Fair, Good, and Very Good for each management activity. Budgetary shortfalls or gains were calculated by subtracting the actual spending levels from the managers estimates.
Across the 41 protected areas the performance scores, spending and cost data was analysed as:
• individual NPs (or groups of parks were they were managed as a single unit),
• yearly averages, and
• in relation to 24 management activities based on a pre-existing QPWS classification scheme.
These management activities were group into four categories: Biodiversity Activities, Visitor Management, Cultural Historic and Indigenous Heritage, and Administration and Management.

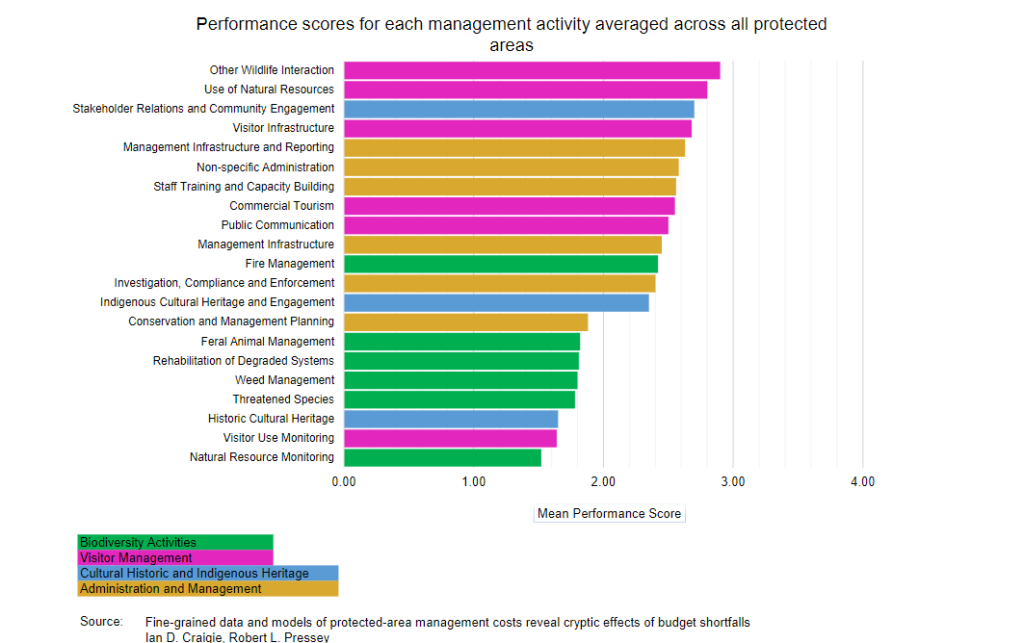
The first Graph shows the performance scores as assigned by park managers for each of the 24 management activities averaged across all 41 protected areas.
The pink bars show the category of Visitor Management; specifically Wildlife Interaction, Use of Natural Resources, and Visitor Infrastructure, followed by Commercial Tourism and Public Communication; had the highest average performance score (Fair to Good or between 2 – 3).
The second highest performance scores were in the category of Administration and Management as shown by yellow bars, which includes Management Infrastructure and Reporting, Non-specific Administration, and Staff Training and Capacity Building (also Fair to Good or between 2 – 3).
Biodiversity Activities with green bars, such as Feral Animal Management, Rehabilitation of Degraded Systems, Weed Management, Threatened Species, and Natural Resource Monitoring, scored the lowest for performance (mostly Poor to Fair or between 1 – 2). It should also be noted that no activities were performed Very Good (4).
Regarding costs and spending on management actions to achieve park objectives, Visitor Infrastructure absorbed by far the largest single proportion of the total budget at 25% of the budget.
Management Infrastructure and Reporting was second with 10.1%. By comparison, the six management activities focused primarily on conserving biodiversity which include Fire Management, Management of Feral Animals and Weeds, Natural Resource Monitoring, Conservation Planning, and Management Of Threatened Species, received in total 28.9%.
During workshops managers often observed that, when resources were scarce, trade-offs favoured activities related to maintenance and cleaning of visitor facilities (e.g. toilets, campsites, paths).
This was primarily to avoid complaints from visitors and reflected the perceived urgency of these tasks.
According to managers, this prioritisation led to a shortage of resources for other activities such as those focused on biodiversity protection.
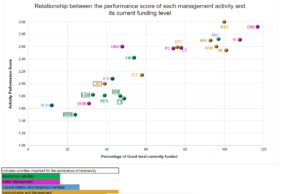
The second graph brings these two pieces of data together, performance scores and costs and spending. It shows the relationship between the performance score of each management activity and its current funding level. Again, the pink represents Visitor Management and the yellow represents Administration and Management.
Both of these are clustered in the top right-hand corner showing that whilst there was ‘good’ performance in these activities, it was also highly funded. The green dots representing Biodiversity Activities is in the bottom left, means there was low performance in these activities and at a low cost. In short, outcomes show managers are prioritising both actions and budgets towards managing visitor related experiences, supporting managers comments, that this was to the detriment of actions focused on biodiversity management.
Whilst it is not shown in these graphs, the research found that total management spending was correlated with a wide range of factors, but especially the amount of built infrastructure within each protected area. Data on NP management costs are fundamental to effective conservation planning and park management 3.
The outcomes from this study has two important implications. First, unless data on both current and required spending for protected area management is obtained, funding shortfalls cannot be properly estimated, and appropriate budgets be established.
Second, if the same kinds of trade-offs are being made to the detriment of biodiversity conservation in other NPs, the shortfalls highlighted in this research are an underestimate of the overall shortfalls of investment in high value biodiversity across Queensland.
Without reliable data on both spending and costs, it is impossible to relate them to factors that influence them, and to estimate shortfalls in current expenditure. With record budgets for protected areas announced this year by the Queensland Government, the direction and allocation of these resources towards biodiversity conservation and management are important to changing this long-running trajectory of shortfalls.